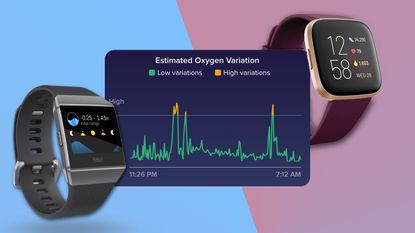

As of this week, all Fitbit Charge 3, Ionic, Versa, Versa Lite, and Versa 2 users will be able to use the recently announced Estimated Oxygen Variation graph in the Fitbit app. This feature has originally been announced at August last year and began rolling out to some users in January, but from now on, all users can enjoy the extra data.
The new feature doesn't require any hardware update to the smartwatches and fitness trackers themselves; the sensors have already been capable of detecting blood oxygen levels, it's only the software that needed some extra time to catch up.
- Best Fitbit: all Fitbits ranked, from most to least amazing
- Best Fitbit deals: January sales offers on cheap Fitbit Versa 2, Charge 3, Ionic and the rest
- Best fitness tracker: track steps, activity, sleep and cardio

An extra layer added to your sleep stats
What is the Fitbit Estimated Oxygen Variation graph?
The sensors found on compatible Fitbit wearables utilise the red and infrared sensors on the back of the device to estimate the variability in your blood oxygen saturation level.
In Fitbit's words:
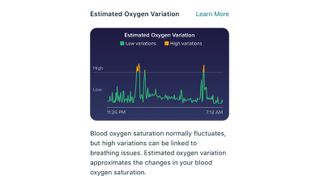
"The graph, which users can see in the Fitbit app under the Sleep tile, approximates the changes in your blood oxygen saturation while you sleep. Blood oxygen saturation measures the percent of your blood that’s saturated with oxygen."
"Typically, it’s at 95-100%, meaning the blood is carrying as much oxygen as it can. If you stop breathing or have other lung issues, the saturation level can fall since less oxygen enters the body. In general, variations should be low and seeing frequent, big variations could be a sign that you may be experiencing breathing disturbances during sleep."
Upgrade to smarter living
Get the latest news, reviews, deals and buying guides on gorgeous tech, home and active products straight to your inbox.
- Best cheap Fitbit Charge 3 deals: get this slim fitness tracker for under £100/$100 in the UK and US
- These cheap Fitbit Versa and Versa 2 deals can save you up to £80/$68 off in UK and US
- Best running watch: the best fitness watches for running, gym, workouts, cycling and hiking

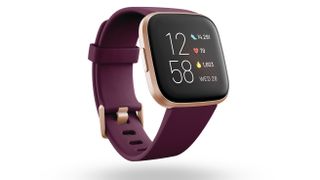
One of the compatible devices: the ultra-popular Fitbit Versa 2
Is the new Estimated Oxygen Variation graph a useful feature? It is for people who like to keep track of as many of their body's metrics as possible. It is much like using a Fitbit Aria Air to track changes in your body weight and feed it into the Fitbit App; but in this case, adding the extra data doesn't cost you a penny.
Having more data for no extra cost is a good deal and even if you don't want to look at your blood oxygen levels daily, it's definitely a good idea to keep track of the long-term trend.
Needless to say, the Estimated Oxygen Variation graph won't replace your GP and if you have any concerns, please consult a health care professional about any questions or health issues you may have.
More Fitbit deals

Matt Kollat is a journalist and content creator who works for T3.com and its magazine counterpart as an Active Editor. His areas of expertise include wearables, drones, fitness equipment, nutrition and outdoor gear. He joined T3 in 2019. His byline appears in several publications, including Techradar and Fit&Well, and more. Matt also collaborated with other content creators (e.g. Garage Gym Reviews) and judged many awards, such as the European Specialist Sports Nutrition Alliance's ESSNawards. When he isn't working out, running or cycling, you'll find him roaming the countryside and trying out new podcasting and content creation equipment.

